Track, rinse, repeat.
Like a skin or beauty routine, tracking and analyzing key metrics of beauty subscriptions requires regular attention. Performing data analysis helps us as marketers make informed, data-driven decisions. This is an integral part of a competitive subscription industry that requires constant attention and fluidity to remain successful as a business.
But metrics don’t mean much unless you know how to contextualize them. It’s essential to build segments to understand why a specific audience is behaving in a certain way. And looking at key trends and how they relate to other data points will paint a clearer picture of what your data is telling you.
These are the critical behaviors to accurately measure the growth of your subscription beauty brand:
- Build user segments
- Track total and recurring revenue
- Measure customer acquisition cost and customer lifetime value
- Identify average length of subscription
- Understand your trial sign-up and conversion rates
Building User Segments
Before we dive into tracking key metrics, we first want to build segments of users based on certain types of behavior. Groups of a user base behave in different and unique ways, and creating these segments help us see that behavior more clearly in our data.
We build these key segments in Google Analytics, and apply them across reports for efficient analysis.
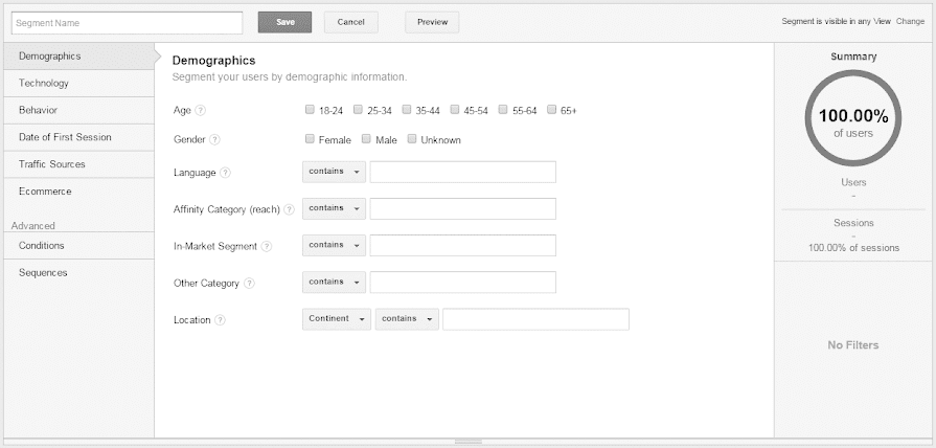
For your beauty subscription business, build the following segments to get a better view of your website visitors and customers:
- High-Value Purchasers – Purchasers who spend in the top 10%. Analyzing their behavior helps us understand what led them to become top spenders. From there, we look to find ways to help other customers take the same steps to become top tier purchasers.
- Device Type – People tend to browse rather than purchase on mobile and have lower average order values (AOV) when they do decide to make a purchase. Desktop users tend to purchase higher-ticket items and have a stronger conversion rate. Identifying these trends or others is crucial for making smart decisions about your website.
If behavior varies across device types, it signals the need for dynamic site content. This may include different product offerings and calls to action. We’ve found that introductory trial offers for beauty subscriptions work great on mobile, whereas actual conversions occur at a higher and more efficient rate on desktop.
- Cart Abandoners – Those who abandoned the cart may do so for similar reasons. Look for trends like which products are most often in the cart when abandoned, which pages the users were on when they abandoned the cart, and where users came from as a source. These may indicate a need for site optimizations and/or additional marketing channels.
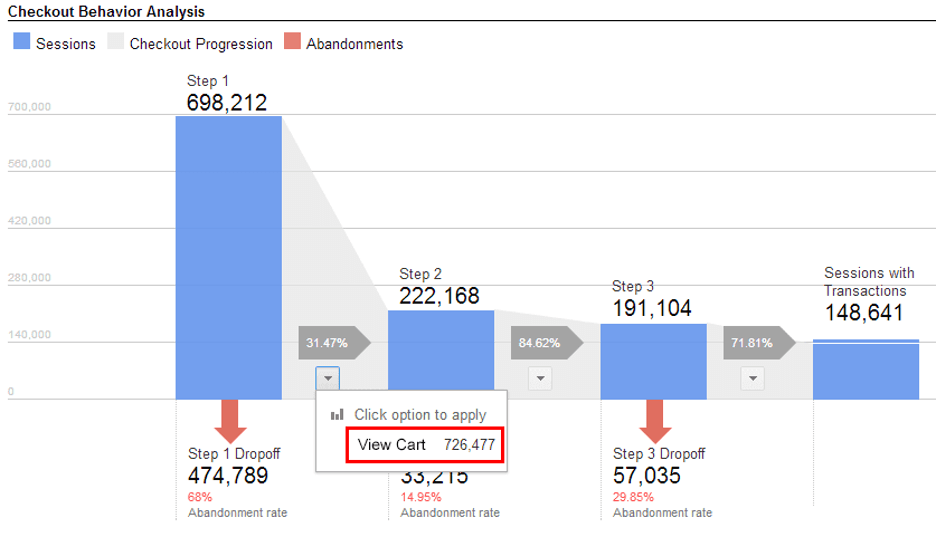
Along with abandoned cart behavior, it is also important to monitor checkout behavior. If users are leaving the checkout process at a particular step, it’s time to figure out why.
Use enhanced ecommerce on Google Analytics to get a step-by-step funnel view of checkout behavior. It is important to note that the checkout behavior report will not work for Shopify merchants if you implement enhanced ecommerce through Shopify’s preferences. To get around this, build a destination-based goal in Google Analytics that creates a funnel visualization similar to the checkout behavior report.
Here are some insights we’ve come to in the past by analyzing cart and checkout behavior:
- Users who joined a brand’s rewards program abandoned carts at a much lower rate than those who didn’t, but the vast majority of users were simply unaware of the program’s value. This means the rewards program value propositions weren’t clearly stated.
- By segmenting abandoned carts by source, we saw that users arriving from Google Ads were not converting at the rate expected, and were bouncing at a high rate. We determined this was due to the lack of landing pages that better communicated product value and connected better with the messaging of the ad itself.
- Users arriving from organic sources that did not have SEO-optimized tags and titles bounced at a higher rate, while shopping less and abandoning their carts more. Meta descriptions and title tags inform the user about the landing page. The lack of title and meta optimization misinformed users about their next page, causing the higher bounce rates and cart abandonments.
- Business-Specific Segments: Of course, these aren’t the only segments you can build, just the essential ones. For more ideas about additional segments you can create to better understand your beauty subscribers, look here.
Once you create the audience segments you want to learn more about, it’s time to determine the metrics that are important to your business.
In our experience, the five most critical performance metrics for beauty subscriptions are:
- Total Revenue
- Customer Acquisition Cost
- Customer Lifetime Value
- Average Length of Subscription
- Trial Conversion Rate
Total Revenue
Revenue is the most important metric to monitor to measure your subscription’s success. Revenue growth signifies that your customer base is responding to the products you’re selling.
Tracking revenue for subscriptions can be tricky, though.
Google Analytics, by default, treats each subscription cycle as a separate transaction. This is problematic because it does not accurately portray the number of subscribers or lifetime value of a customer. Number of subscribers is inflated, while lifetime value is under-counted.
To compensate for this, track recurring revenue. Setting up recurring revenue tracking in Google Analytics is complicated. It requires close collaboration with a developer or experience with back-end coding. Essentially, you can track recurring revenue with userID, as described in this Optimize Smart tutorial.

With this implementation, users are connected to their subscription with a userID, and subsequent cycles are billed based on their userID. UserID is a more advanced version of Google Analytics’ Client ID, and sticks with users across multiple sessions as long as they’re logged in on the site.
Keep in mind that, because users must have created an account, the segment of users with UserID are likely to be more engaged than the site’s typical user, and the sample size will be limited.
Most easily implemented through Google Tag Manager, userID does not violate personal information regulations. By using UserID, we get a more accurate picture of customer lifetime value and conversion rate by keeping track of users returning to the site over an extended period of time.
You can debug and verify your tracking implementation through Google Hit Builder. Use Google Hit Builder to send artificial hits to Google Analytics and ensure that you are sending through the required parameters properly.
Once you are confident in your revenue tracking implementation, utilize it to analyze which of your key segments are driving the most revenue. With knowledge of which segments drive the most revenue, you can make more educated decisions about which channels bringing in certain customers provide the most return on investment.
You may uncover, for example, that your organic social traffic is driving more revenue than expected. From there, you might segment by age, and find that the vast majority of social media-based revenue is generated by an age range of 18-24.
Through segmentation, you’ve now uncovered that additional investment into social media creative that best resonates with a younger crowd will lead to a stronger return on investment than creative that attempts to speak to a broader audience.
It is important, however, to consider scalability and efficiency before over-investing in a segment that may not be as lucrative as it seems at the surface level.
Customer Acquisition Cost (CAC) and Customer Lifetime Value (CLTV)
Customer acquisition cost and customer lifetime value are two separate metrics that make better sense together. First, we’ll go over what they are and how to measure them, then we’ll discuss how they complement each other.
Understanding CAC and CLTV
Customer acquisition cost measures how much your company spends acquiring a customer.
For example, let’s consider a brand, C Beauty Marketing, that is advertising its products on Google Ads and is seeing the following metrics:
- Conversion rate of 10%
- $2 Cost-Per-Click
With an expected 10% conversion rate, we know that it will take an average 10 clicks to convert a customer.
Each click costs $2.
10 clicks per customer at $2 per click totals up to a customer acquisition cost of $20.
Customer lifetime value, on the other hand, measures the value of a customer throughout their entire experience with your brand. While you can use Google Analytics’ built-in lifetime value report to track customer lifetime value at a high level, it is better to track lifetime value manually to get a deeper level of insight and avoid the limitations of Google Analytics’ UserID feature.
Data from other sources, like Shopify, provide more accurate by-user information that Google Analytics can only keep with UserID. As UserID is typically tied to a customer’s account on the site and will only track a customer once they are logged in, multiple guest checkouts or duplicate customer accounts with different emails from a single customer will lead to inaccuracies in customer lifetime value.
Careful manual lifetime value tracking can eliminate the majority of these errors, arming you with more accurate data to make future marketing decisions with.
Don’t make decisions about products based on a short lifetime value window. Allow the data to collect over time. You may come to find that a customer’s lifetime value stretches months, or even years, longer than you expected.
When lifetime value begins to flat-line, you’ll know that your segment has reached its peak value. From there, it’s time to make a decision about whether it’s better to invest in preventing churn, or to recognize that a customer is no longer valuable to the company and to cease efforts in preventing churn altogether with the understanding that marketing efforts are better spent on still-interested customers.
Analyzing CAC and CLTV
Customer Acquisition cost and customer lifetime value are best analyzed together. When paired with customer lifetime value, customer acquisition cost informs us about how much to spend on each segment while remaining profitable.
In the case of C Beauty Marketing above, we found that customer acquisition cost was $20. We could then determine that the lifetime value of customers acquired through Google Ads must be greater than $20, plus the cost of goods sold, to make advertising through Google Ads worthwhile.
You must be particularly aware of acquisition costs and lifetime value when working with beauty subscriptions. Customer lifetime value is typically higher than it is for a traditional ecommerce website because of the multi-month nature of subscription transactions. This means you can spend more on acquiring a customer for a subscription than your typical ecommerce counterparts. But pay careful attention to ensure that these costs do not push past profitability.
Similarly, if you make changes to the nature of your subscription that affect customer lifetime value, monitor your customer acquisition costs to see how these changes impact a customer’s desire to subscribe.
Think of Birchbox as an example of a brand who failed to scale with new strategies. Birchbox first led the beauty subscription industry before developing a variety of new offerings, like a more expensive box and men’s boxes.
Commenting in The Startup, an author for Woden wrote:
“These various product attempts sent a clear message: Birchbox was more concerned with generating revenue — whether it be from beauty manufactures, men, or higher income women — than with understanding and empowering their core customers (who remain their primary source of revenue).”
By offering new products and services, Birchbox expanded its customer base, but not with the same reliable revenue.
Birchbox falsely assumed it could increase revenue without having to rely on long-term relationships with its customers, ignoring what drew its core audience to the brand and caused them to spend more over time in the first place. This is highlighted by the fact that the brand’s core customers remain its primary source of revenue.
Birchbox’s focus on revenue instead of the brand’s core audience and Ipsy’s use of strong branding and influencer network resulted in Ipsy acquiring over double Birchbox’s monthly subscribers.
This serves as a reminder that while data may support potential scale, the impact of scalability must be carefully considered prior to doing so. Customer acquisition cost and lifetime value provide actionable insights, but only tell the complete story when considered alongside the unique attributes of your brand.
To stay on top of acquisition costs and lifetime value, set up a thorough performance dashboard. These dashboards visualize the costs of acquisition at both platform and aggregated levels.
At the platform level, you can optimize individual ads and placements to improve performance. At a higher level, you can monitor changes in acquisition cost and lifetime value as your brand grows, ensuring that costs are trending down while lifetime value increases over time.
Average Length of Subscription
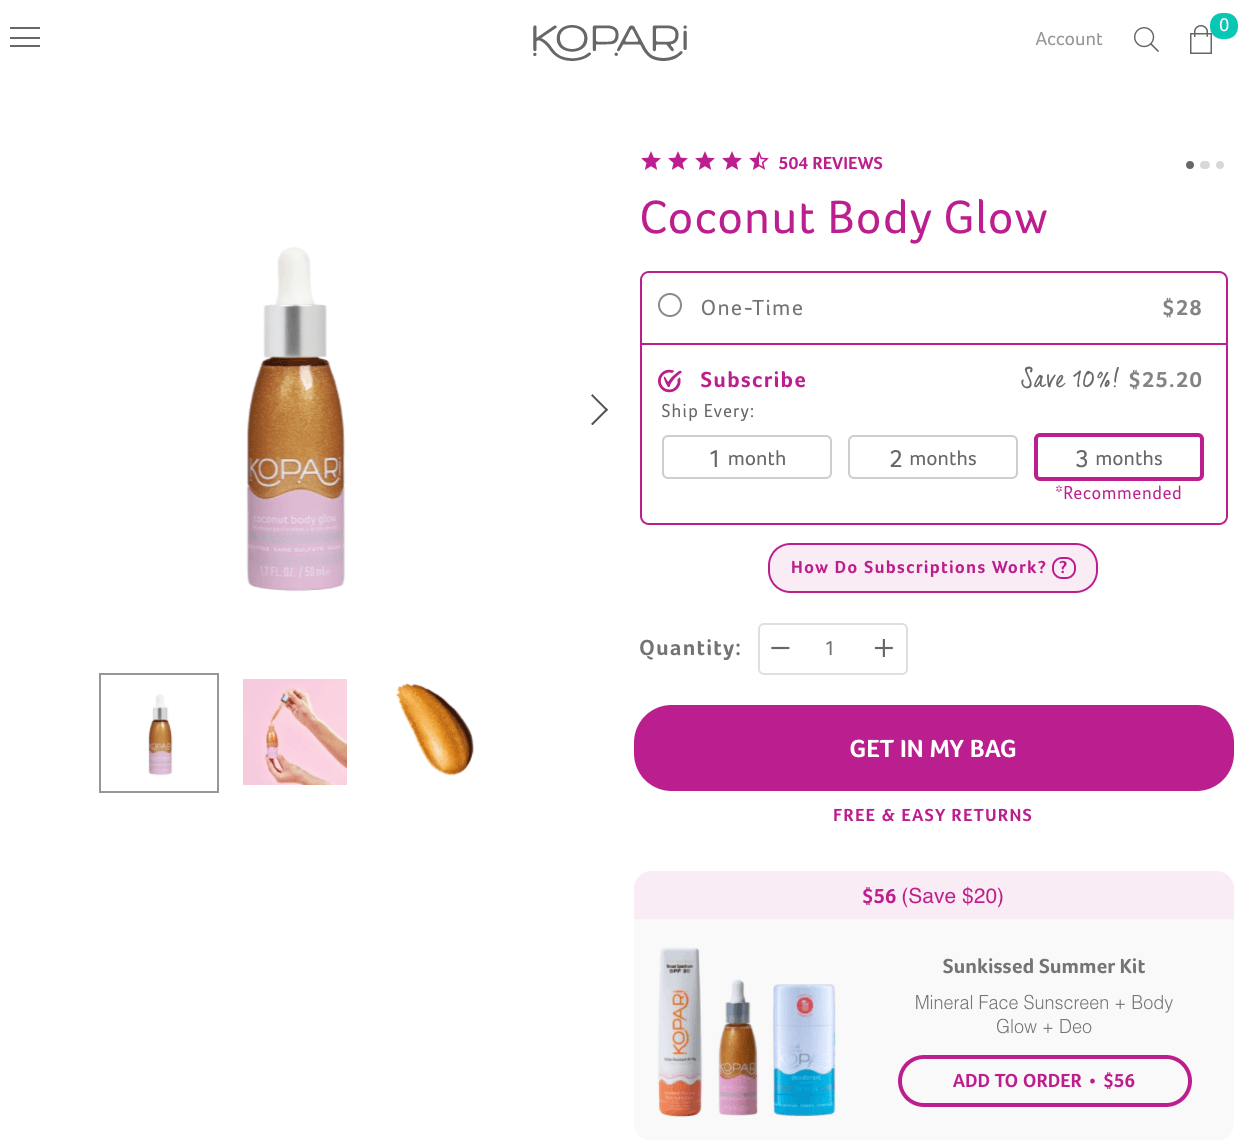
Speaking of watching customer acquisition cost and customer lifetime value over time, track the average length of a user’s subscription to learn more about long-term interest in your products. This directly ties into customer lifetime value, and is a metric that pairs well with product-by-product segmentation.

If subscriptions across the brand vary in price and length, or if you offer a replenishment subscription option on individual products like Kopari Beauty does, segmenting by product allows you to see how long, on average, users subscribe to each different subscription or product.
Breaking down the average length of subscription by product also provides us with information about which subscription or product variant is providing the most value to the company. One option may have a higher monthly cost, meaning more revenue for you, but a shorter length of subscription.
If the average length of subscription is significantly lower than the lower-priced version, it may be worthwhile to push the lower-priced subscription more because it better fits customer desires and produces more long-term benefits for your business.
Think about it — you get more value out of someone subscribing to your $10 beauty box for six months than you do from someone cancelling your $20 super beauty box after two months.
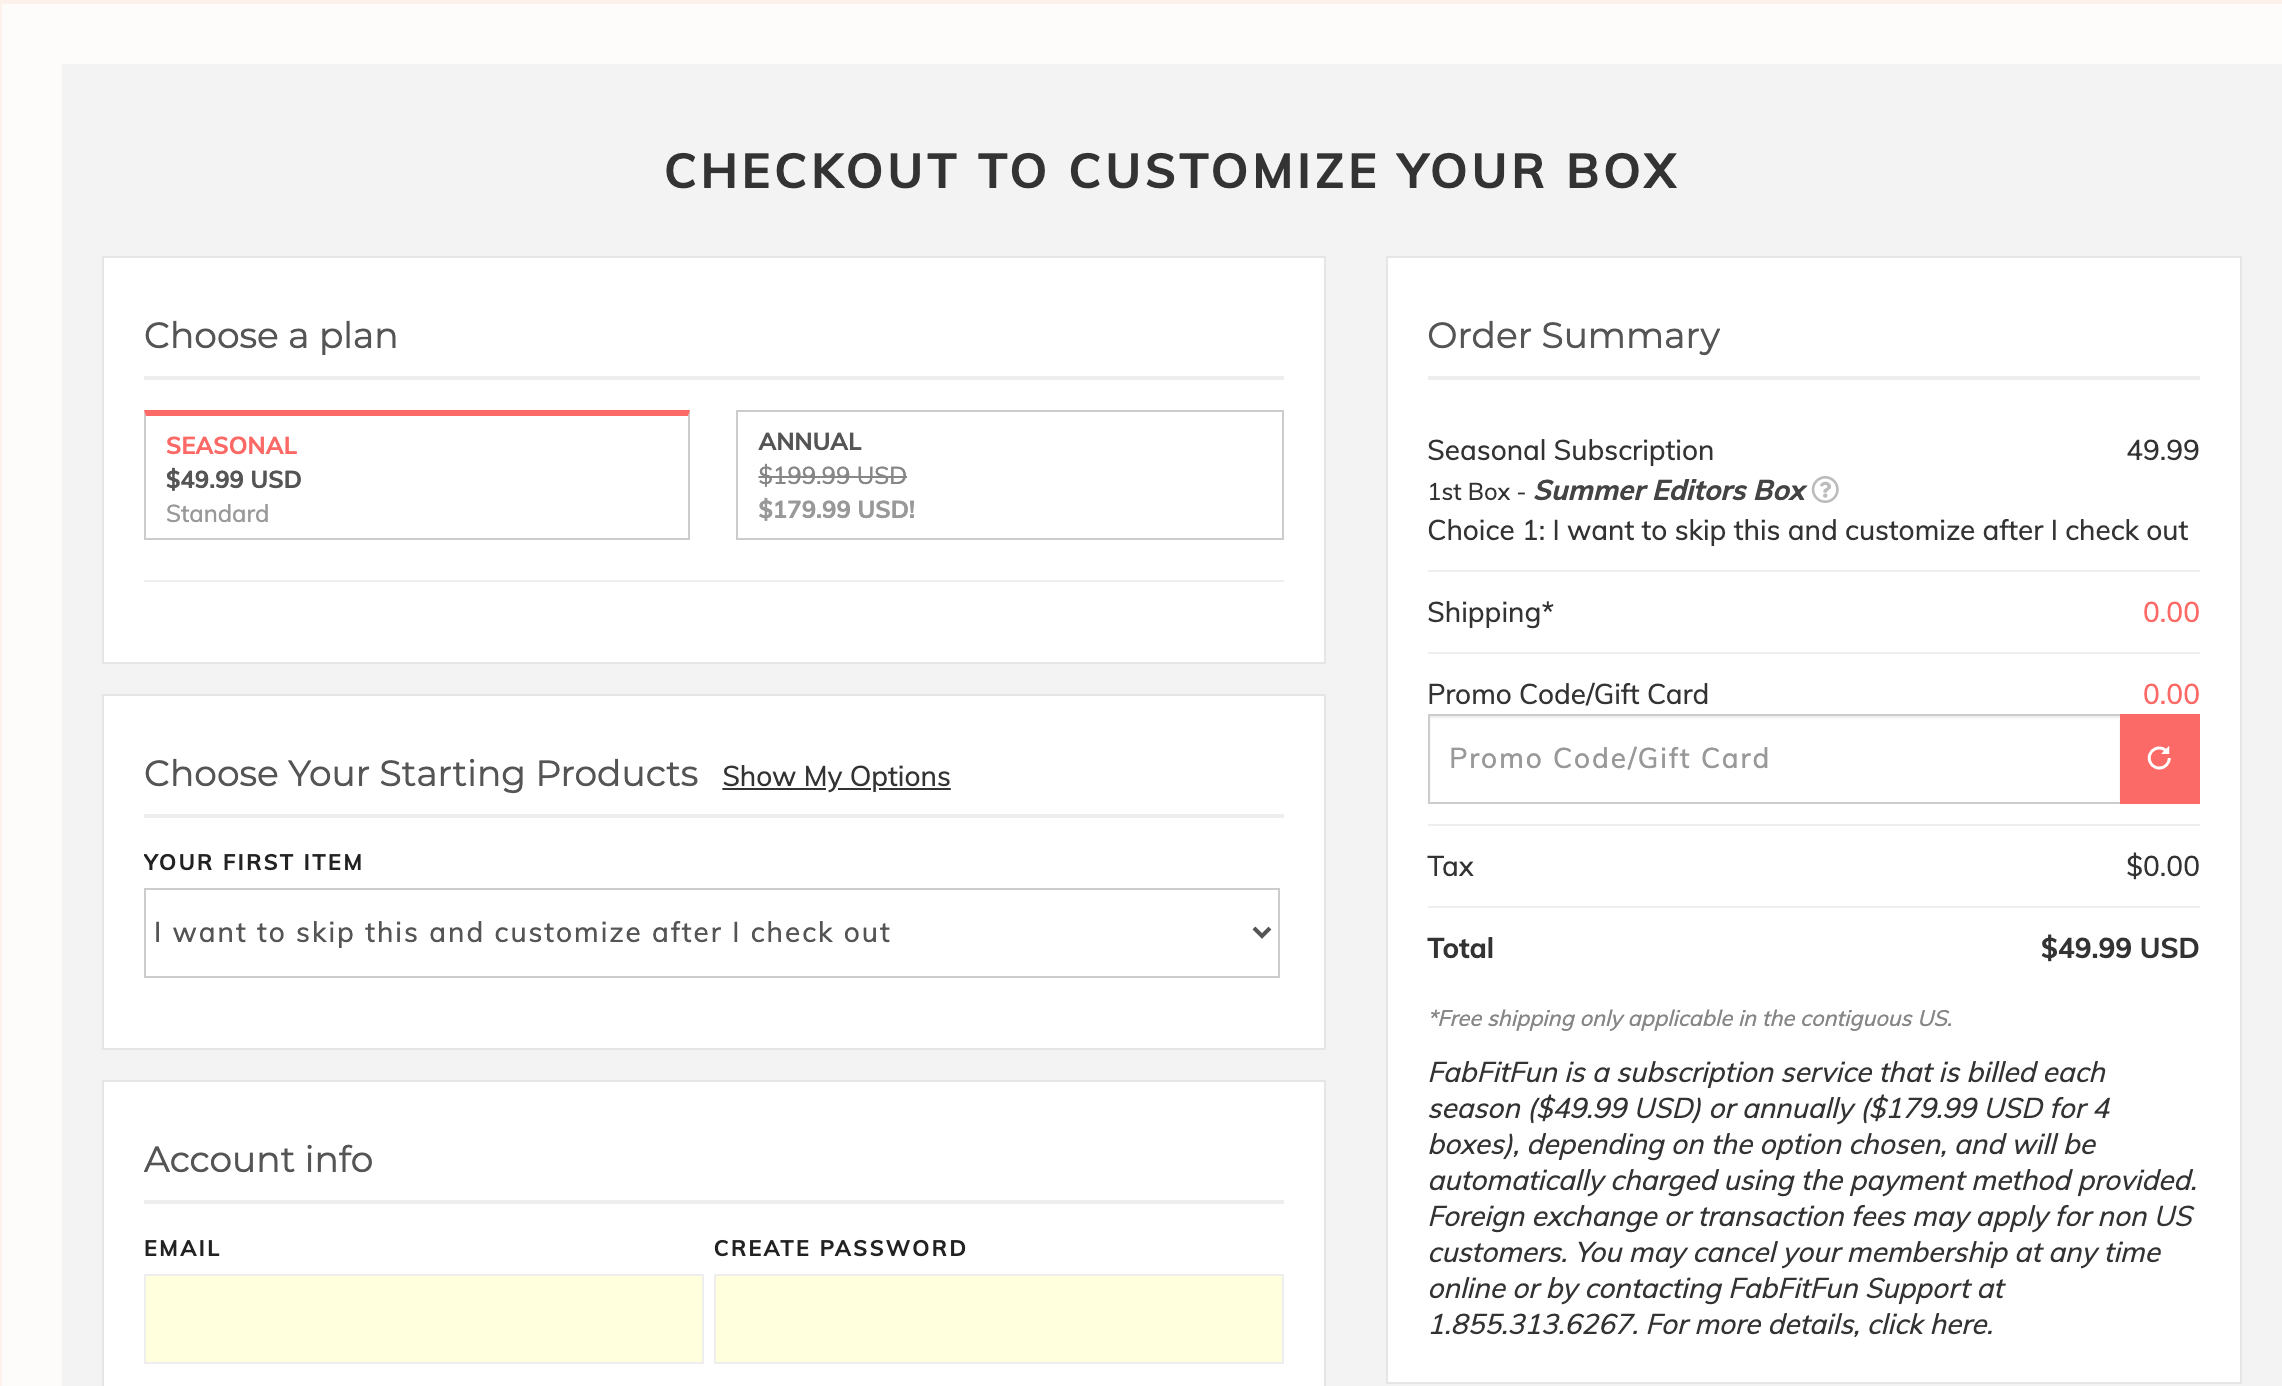
FabFitFun gives users the option to subscribe annually for a discount, or quarterly for a premium. By comparing the performance of both options, FabFitFun can see if the average quarterly user is keeping the subscription long enough to provide more value than the annual subscription, or if the quarterly subscriptions are actually hindering profitability.
Looking at the average length of a subscription for users by segment also helps us identify customers that may churn soon. The point where the lifetime value curve begins to flatten indicates the point where customers are churning often.
Dig into your segments a little more closely: Are there certain behaviors you’ve observed in previous customers that suggest a user will churn? Others that indicate a user is more likely to stick around?
With these insights, we look to minimize behaviors that lead towards churn, and build on behaviors that improve stickiness. Put your measurement of average length of subscription in context with engagement metrics like bounce rate, pages per session, and blog engagement rate to identify keep inflection points that influence churn over the course of a customer’s subscription.
For example, we may find that users churn less or keep their subscription longer with a higher initial add-to-cart rate on their first session. This means we could optimize the site for more cart additions.
Optimizations for increasing add-to-carts include:
- Increasing the “add-to-cart” button size to encourage button clicks
- Adding “add-to-cart” callouts on the homepage to speed up the shopping flow
- Including “add-to-cart” buttons on the product listing page (PLP) to reduce the number of clicks to get to an add-to-cart
- Enlarging product cards on the PLP to a three, or even two-wide product layout to focus attention on the product versus the entire collections page. Larger and more spread out products on the PLP almost always perform better.
For customers that behave in a way that indicates churn, reach out to try to prevent it. One way to do this is with email. These emails should not be a sales pitch, but instead should rekindle customer interest in the brand. This contact is a final push to reduce churn before eliminating additional spend on a customer that is no longer profitable for the company.
Read our full email playbook for subscription beauty brands looking to prevent subscriber churn here.
Trial Sign-Up Rate/Conversion Rate
Trial sign-up and conversion rates are two more key metrics that help measure your beauty subscriptions’ growth. You want your trial offer to be compelling enough to convince those uncertain of subscribing to try it out. But you also want to know that once someone signs up for a trial, your marketing and messaging is effective at converting them to a full customer.

By knowing how likely a user is to sign up for a trial, then convert, you can decide which platforms you can afford to profitably market the trial, and if any details of the trial need to change.
Let’s take our example from earlier a step further. C Beauty Marketing wants to know how often their trial is leading to a full subscription. They’ve seen the following performance:
- Trial sign-up rate of 25%
- Of that 25%, 10% convert to the full subscription.
- $2 Cost-Per-Click
25%, or one of four people sign up for the trial, and 10% of those trial sign ups actually convert to the full subscription. This means 2.5%, or one in forty total potential customers purchase the actual subscription. Each click costs $2, and with an expected 2.5% conversion rate from trial to full subscription, we arrive at the $80 customer acquisition cost.
Always use customer acquisition cost to inform your required lifetime value to remain profitable. In this case, because the customer acquisition cost is $80, we know that a customer lifetime value of greater than $80 is required to make advertising to this segment on this specific channel worthwhile.
Putting it Together
To truly understand your beauty subscription’s success, you must understand the relationships between each metric and what they say about your brand.
Ipsy, for example, personalizes subscriptions based on a user’s quiz results. From there, Ipsy uses AI to create a subscription box with curated products that best fits the customer’s interests.
The results of this test involve analysis of all of the key metrics we’ve mentioned in this article — total revenue, customer acquisition cost, lifetime value, and conversion rate.
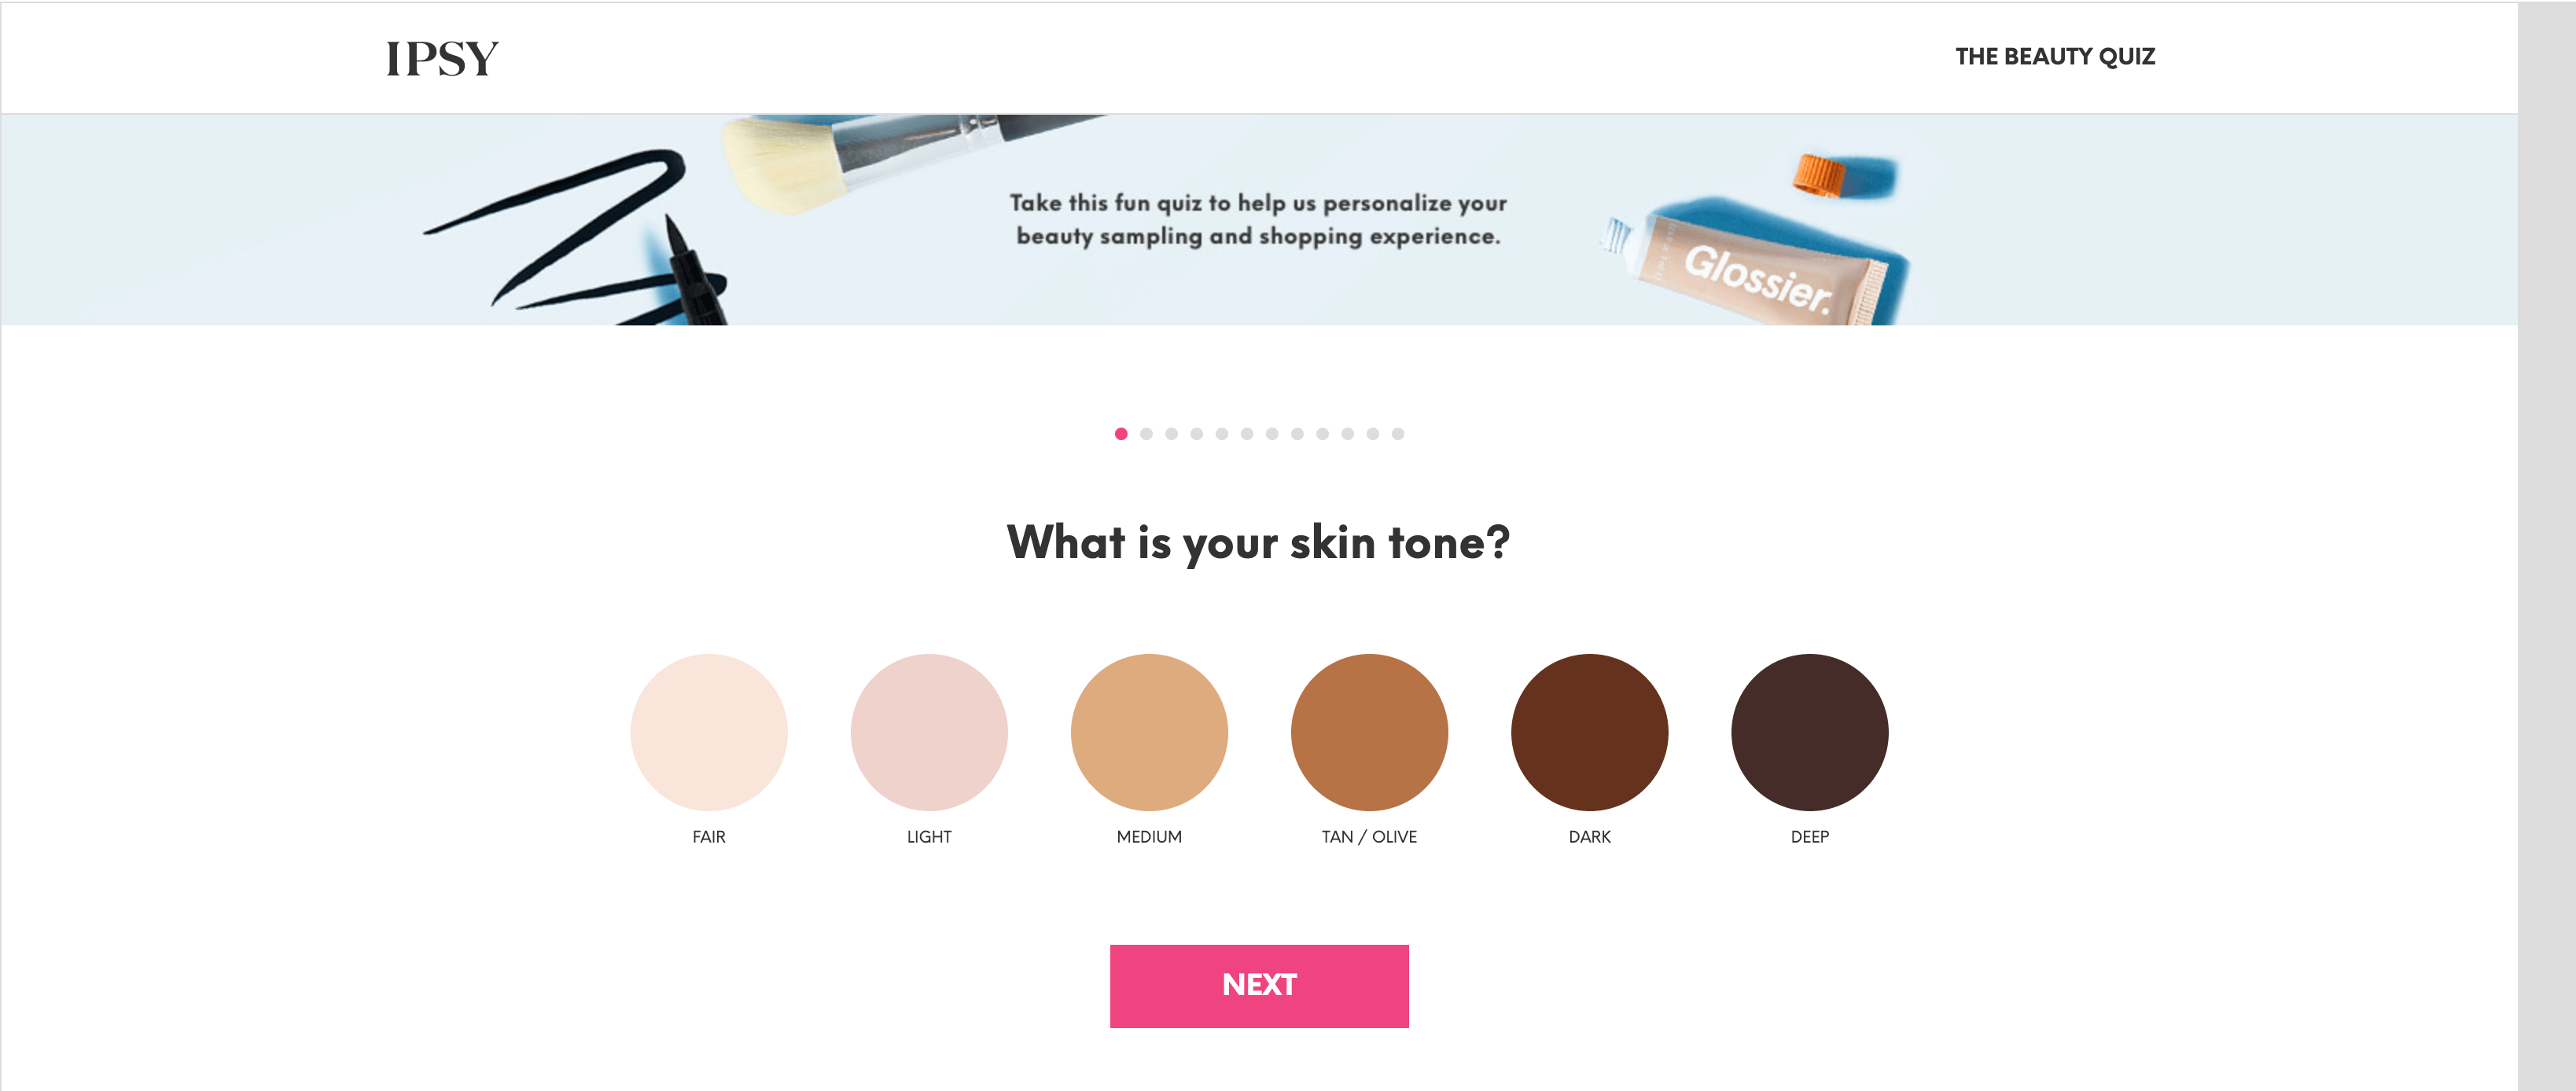
One of the core questions of Ipsy’s personalization quiz is, “what is your skin tone?” This question alone will change the recommendations Ipsy makes for other products down the line, like concealer, foundation, and even eyeshadow and lip color.
In this case, we would create a different segment for each of Ipsy’s skin tone possibilities since it’s one of the consistent differentiators between customers. Ipsy will want to look at each segment’s customer acquisition cost, lifetime value, and conversion rate individually because differences in performance will inform the brand about where its AI-driven product recommendations are providing the best value, or are not doing a good enough job of meeting customer needs.
From there, Ipsy can work to ensure that all of its segments are served accurate product recommendations, with the hope of increasing the lifetime value of its segments, ultimately leading to an increase in overall revenue.
Every metric leads back to revenue, and it is important to remember that the goal is to optimize for the most possible revenue in the long run, rather than quick wins that distance you from that goal (e.g.. Birchbox).
Track Your Way to Ecommerce Success
The beauty subscription industry is temperamental and competitive. Market leaders struggle to stay on top with increased opposition from new entrants with unique ideals. For that reason, it is crucial to make decisions informed by data and to know where your business stands within the industry.
Through segmentation and proper tracking of key metrics, we as marketers can make better decisions and remain relevant despite the tense competition.
In fact, beauty brands can thrive in a market that 11% of online shoppers are a part of, and a further 40% are interested in subscribing to. With such a large demographic to target, it’s a matter of who reaches the customer best and with what offers, which growth metrics and supporting segments help inform for better, smarter marketing.
We partner with brands to improve the overall e-commerce experience for customers. Learn more about Barrel and the work we do for growing brands.
Featured image courtesy of Business of Beauty.