An ecommerce website can throw off a dizzying array of data, and it’s easy to get caught up with tracking too much. We advise our clients to focus on a few basic metrics to assess ecommerce performance before diving into analyses of channels and user behavior.
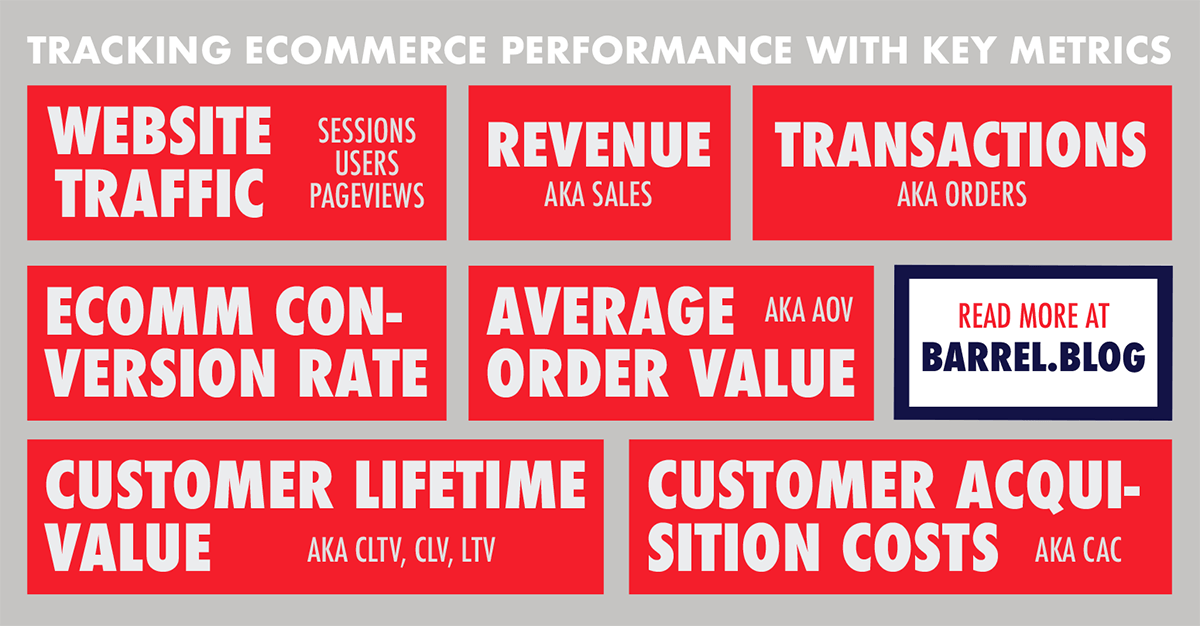
The key metrics are:
- Website Traffic (Sessions, Users, and Pageviews)
- Revenue (Sales)
- Transactions (Number of Orders)
- Ecommerce Conversion Rate (Transactions over Sessions)
- AOV / Average Order Value (Revenue over Transactions)
- CLTV / Customer Lifetime Value
- CAC / Customer Acquisition Cost
Note: I wrote this post with the assumption that the primary ecommerce channel for the business is its own ecommerce website (e.g. sites on Shopify, Magento, or some other ecommerce platform). This may not be the case for many ecommerce businesses that sell largely on Amazon, eBay, or other marketplaces.
Website Traffic (Sessions, Users, and Pageviews)
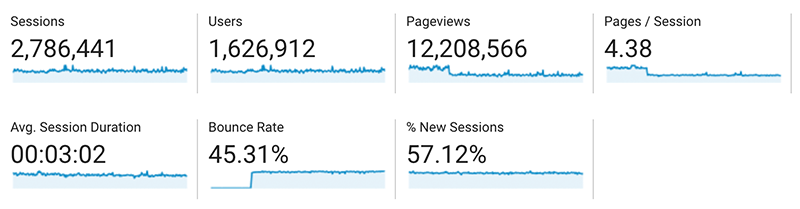
Where to find it: Google Analytics, under Audience » Overview
Why it’s important: The amount of traffic a website receives is its lifeline. Without new users, ecommerce sales cannot grow. On Google Analytics, you can monitor the number of sessions (what Google defines as the period time a user is engaged actively with the website), the number of users, and the number of pageviews.
What to note: View the numbers at daily, weekly, monthly, year-to-date, and one year levels. Use the “compare to:” feature in Google Analytics to compare with previous periods, especially year-over-year. Is your website traffic on an upward trend? How have different marketing and website optimization efforts impacted your traffic performance? Have you attracted more session and users? Have users stuck around and viewed more pages?
Tip: Use the annotation feature in Google Analytics to leave notes for yourself throughout the year as you launch new paid media campaigns, get PR coverage, or get mentioned by a popular influence on social media. Later on, these annotations will be helpful in making sense of traffic and sales bumps in the data.
Revenue (Sales)
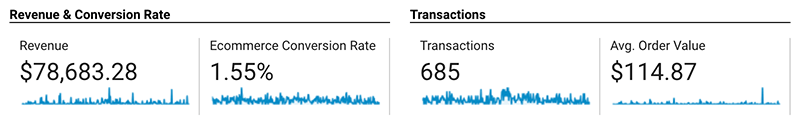
Where to find it: Your ecommerce platform’s dashboard or Google Analytics, under Conversions » Ecommerce » Overview
Why it’s important: The goal of an ecommerce business is sales, and tracking the website’s revenue gives you this key number. Remember, this is a top-line number, so it doesn’t tell you anything about your profits, but it’s a number that’ll signal the scale and volume of the business.
What to note: Similar to website traffic, you’ll want to get a sense of revenue per day, per week, per month, per quarter, and per year. You’ll want to note if revenue performance corresponds to any seasonal factors like the year-end holidays or weather changes like summer and winter. You’ll also want to refer to your annotations (mentioned above) to see if any activities, such as a new product launch or some kind of discount promotion, had impact on website revenues.
Tip: Google Analytics doesn’t accurately capture all the transactions and revenue data and requires some extra work to reconcile with your ecommerce platform. When it comes to revenue and transaction data, we typically use Google Analytics to quickly compare time periods, channel performance, and general trends but we rely on the ecommerce platform’s dashboard to report actual figures.
Transactions (Orders)
Where to find it: Your ecommerce platform’s dashboard or Google Analytics, under Conversions » Ecommerce » Overview
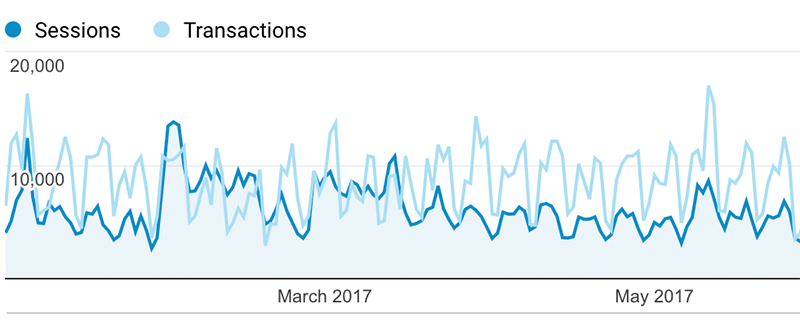
Why it’s important: For the same reasons as revenue, transactions signal the strength of the website’s ecommerce performance and tell you how many of the people coming to the website are actually placing orders. You need to look at both revenues and transactions especially if you have a wide range of products at different price points, as you’ll see in the Average Order Value calculation.
What to note: You’ll want to look at the same daily, weekly, monthly, and yearly totals as revenue and website traffic. When did you log the most transactions? Did that also correspond with your best revenue date? When did you have the fewest transactions and can you recall or spot trends (e.g. seasonality, certain products out of stock, reduced advertising spend, etc.) that led to a lull in orders?
Tip: You may also want to see what time of day and what day of week you get the most transactions. You can use this data to test the timing of your email campaigns and social posts as well as any product launch announcements. These reports can be generated through the Customization section on Google Analytics. Check out this post to get step-by-step instructions on setting up the reports.
Ecommerce Conversion Rate (Transactions over Sessions)
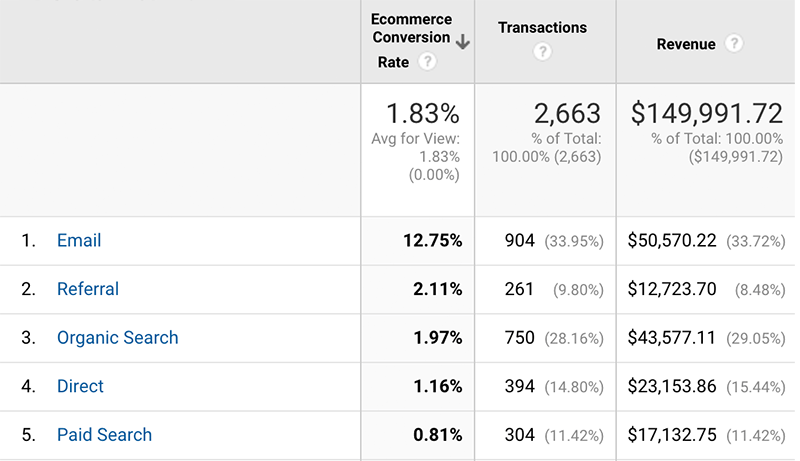
Where to find it: Divide the number of transactions by the number of sessions. Google Analytics, under Conversions » Ecommerce » Overview.
Why it’s important: The ecommerce conversion rate tells you, on average, what percent of sessions will result in an order. It is a quick way to gauge how successfully the traffic coming to the site is turning into revenue. However, it’s important to note that there may be several factors that impact the ecommerce conversion rate and there is often not a magic bullet that will suddenly increase sales and bring up the number of transactions. Some factors may include:
- A buggy or complicated cart and checkout process that leads to abandonment.
- Items being out of stock, which leads to an unconverted session.
- A high organic search ranking for a piece of content that drives lots of traffic but isn’t directly related to converting customers (e.g. a popular blog post on your site that provides tips on a particular topic and isn’t a sales pitch for any particular product).
- Exposure on a high-traffic website or from an influencer’s social media account that leads to lots of new visitors but are not your target audience, leading to brief window-shoppers who may leave after a quick scan of the homepage.
What to note: You’ll want to see how ecommerce conversion rates vary based on the different channels driving the traffic. I recommend going to Acquisition » All Traffic » Source/Medium in Google Analytics to see the various Source/Medium breakdowns. I prefer this to the Channels view because it’s likely that your Default Channel Grouping may not be properly configured. Have a read through this post if you’d like to clean up your Default Channel Grouping and make sure you’re tracking the right sources under each channel. You’ll notice that certain channels outperform others. For example, your Facebook ad campaigns may be driving users who are curious to learn more but not yet ready to buy while the traffic you get from your email list may convert at a much higher rate because they’ve been primed to purchase and may have received some kind of discount incentive to come back and buy.
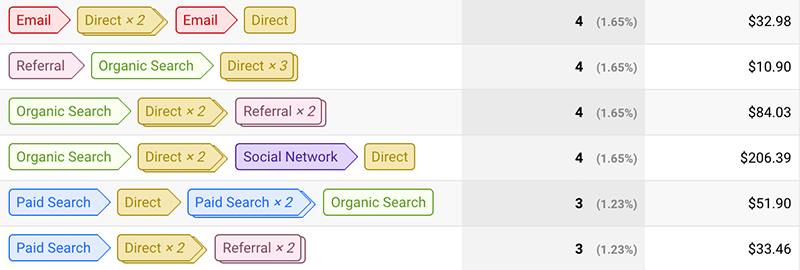
Tip: Don’t let ecommerce conversion rates lead you to think that some channels are automatically worse than others. These conversion rates are based on a last-click attribution model, so Google is only crediting the last channel that the user came from. In reality, channels often work together to nudge a user into converting. For example, a user could have come across a story about the brand on a popular blog and later seen it mentioned on a social media account that they follow. Later on, the user might recall the brand name and type in the name in organic search, visiting the site for the first time. The person might sign up for an email and wait for a promo. When the promo hits, the user, rather than clicking on the email, might just open up the browser and type in the web address. So who gets the credit? The Direct channel would capture the credit even though all these other channels played a part. There are various services and tools that can help unearth this type of attribution trail, including the Multi-Channel Funnels feature in Google Analytics, but many are incredibly expensive and still can’t give the most accurate picture. For ecommerce businesses on a budget, it’s best to keep track of all the various marketing and PR activities going on, make the annotations, and make inferences based on spikes in traffic and sales.
AOV / Average Order Value (Revenue over Transactions)
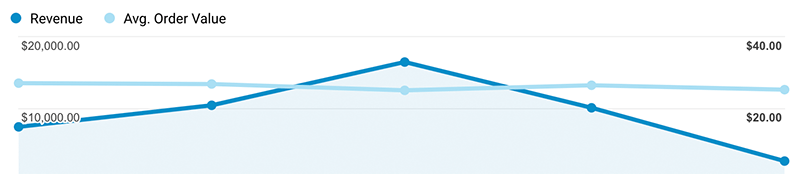
Where to find it: Divide the revenue by the number of transactions.
Why it’s important: Some businesses may find AOV more valuable than others, but it’s generally a useful metric to quickly assess the behavior of customers at checkout. For businesses with a wide range of products that expect customers to add several SKUs to their cart, the AOV is a critical barometer of a store’s health. Even for stores selling a few SKUs, the AOV can signal how many units customers typically buy per order.
What to note: Has AOV changed over time? Have changes in the store’s product mix or the marketing of certain products over others impacted the AOV? How has pricing changed AOV? Or discounting?
Tip: One might think that the higher the AOV, the better the store may be performing, but this is not always the case. It’s important to keep an eye on the absolute number of transactions and revenue in relation to AOV. It could be that cutting prices may actually bring in a lot more customers and increase your overall revenue even though it may negatively impact AOV. Of course, this is something to balance out with your margins and marketing spend.
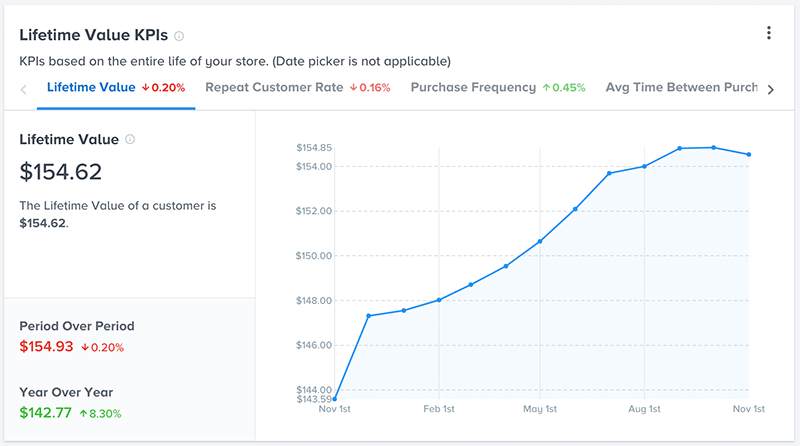
CLTV / Customer Lifetime Value
Where to find it: Your ecommerce platform’s dashboard or a tool like Glew. In some cases, it’s possible you may have to export all sales and customer data and use Excel to calculate the total revenue generated per customer. On Shopify, you’ll not only need to do some manual calculations, but you’ll need at least a year or two worth of data to get meaningful numbers. Here’s a post that details one way to calculate CLTV with Shopify’s exports using the Recency, Frequency, Monetary model.
Why it’s important: The CLTV, especially for businesses that expect customers to return and buy more over time, can help shape decisions on customer acquisition, especially what amounts to spend in order to convert new customers. The CLTV will also reflect the types of products that are sold as well. Those that require frequent replenishment or recurring subscriptions are likely to drive higher CLTV. Businesses that sell a durable appliance, on the other hand, may see their CLTV and AOV top out at around the same levels.
What to note: We typically advise clients to revisit CLTV quarterly, biannually, and annually and to not obsess over it monthly or weekly since they’ll see little change within that time. When it comes to examining CLTV, it’s worth asking if the CLTV supports the business’s marketing activities (covered in the next section). Also, have the rollout of certain retention features such as referral bonuses (Give $10, Get $10), rewards program, and VIP club positively impacted CLTV in any way?
Tip: There’s a lot you can unpack with CLTV because it requires other inputs that can help you understand your ecommerce performance. For example, repeat customer rate (how many customers buy a second time), purchase frequency (how often the average customer buys from you over their lifetime), and the overall relationship length (time elapsed from first purchase to last purchase, with a time set to mark lapsed customers) are all metrics that contribute to CLTV. This isn’t something you need to look at everyday or week, but it’s worth visiting once a quarter to see if you notice changes in the overall number.
CAC / Customer Acquisition Cost
Where to find it: Divide the total costs spent on acquiring customers by the number of new customers, within a specific time period. You might find that sources online have varying views on what should be included in the total costs. We’ve advised clients to include as much as possible, including advertising budgets, all agency fees related to marketing & PR, employee salaries devoted to marketing, and software and services costs (e.g. email service providers, marketing automation software, etc.) just to set a baseline. It’s possible some costs could be re-categorized into something else (or limited to just amounts spent on certain campaigns), but best to start off conservatively and get a higher cost number.
Why it’s important: The CAC helps you determine whether or not you’re spending the appropriate amount given your CLTV. The CLTV to CAC ratio is an essential calculation when it comes to online commerce including ecommerce and Software as a Service (SaaS) businesses. For example, let’s say that an apparel ecommerce business has a CLTV of $450. Their total cost of goods sold (COGS) and operating costs, not including any marketing, make up 50%, or $225 of the $450. That leaves $225 of which, the less that is spent to acquire the customer (and to retain them over their lifetime), the more there is left for profit.
What to note: The CLTV:CAC ratio can tell you a few things about your business. If it’s 1:1 or less, then you are overspending and burning through cash. This might be acceptable very early on in the life of the business, but the ratio needs to quickly improve. We’ve typically advised clients to aim for 3:1 provided the margins support this. You can look at it as spending $100 to acquire a customer that’ll spend $300 over their lifetime.
Tip: You’ll have a handle on CAC only after doing business for a full year. It’s hard to get a stable number unless you’ve gone through all the seasonal factors and also experienced the full spectrum of customer behavior during busy and slow seasons. So if you’re just starting out, keep your eye on the other metrics and revisit CAC when you’ve logged enough data.
Conclusion
The point of looking at performance metrics is to help us make better decisions. The numbers explained above are a starting point for understanding your website’s ecommerce performance and also a way to step back and appreciate the bigger picture in-between deep dives into more detailed data on customer behavior, product sales performance, and paid marketing ROI.